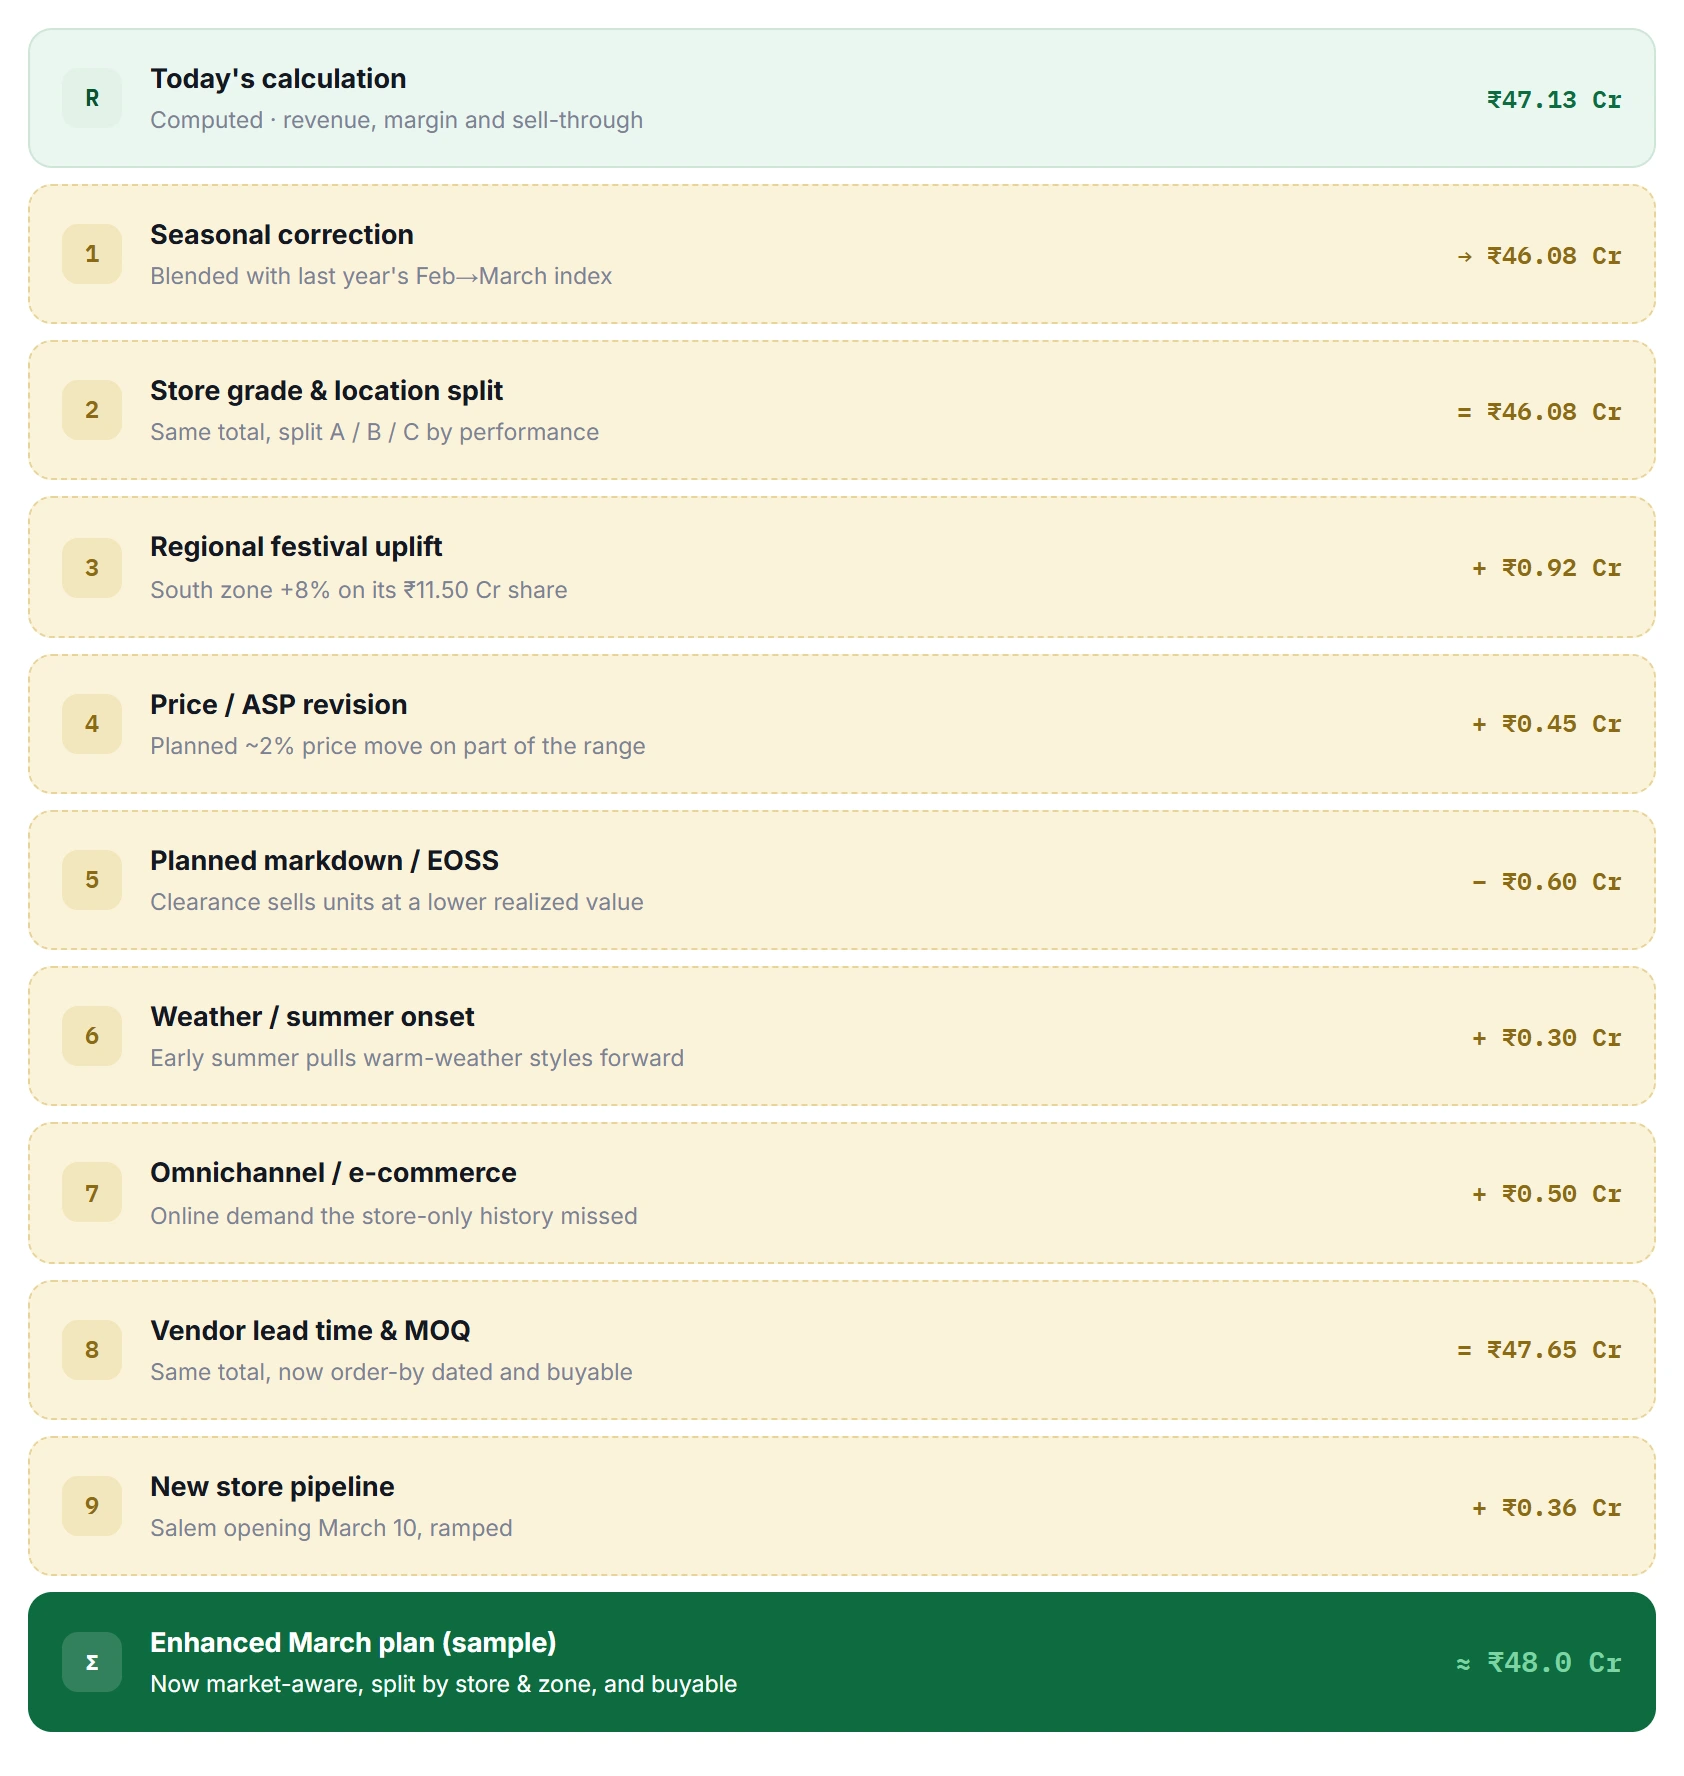
Last month times growth is a guess. A plan is nine named factors, each one auditable, each one a line a planner can question, adjust or switch off.
Deep Dive9 min readAug 2026
The baseline the system computes before a single market factor is applied: February × 1.3436 = ₹47.13 Cr. Worked example on a sample MENS WEAR dataset.
Somewhere this week, a planning meeting will open with a number on a slide. March: ₹47 crore. Heads will nod. And if anyone in the room asks the only question that matters, where did that come from, the honest answer at most retailers is some version of: last year, times a growth number we felt good about. The number isn't wrong, exactly. It's unexamined. It can't be argued with, because there is nothing inside it to argue about. That is the real difference between a forecast and a plan, and it is the whole subject of merchandise financial planning.
This piece walks one division of a sample dataset, menswear, from raw actuals to a March plan that reconciles line by line. The numbers are illustrative; the mechanism is the point. It is the same walk we run on live data, and every step of it is visible.
Where the baseline comes from (and why it isn't last year × 10%)
Start with what actually happened. January sold ₹54.85 crore; February sold ₹35.08 crore. A 36% month-on-month drop, which looks alarming until you know the season, and the season is exactly the kind of thing a naive trend line doesn't know. Project that slope forward and March collapses. Project last year plus a hopeful ten percent and you've ignored this year entirely. Both are guesses wearing spreadsheets.
A better baseline asks a sharper question: not how much did we sell, but how far did sales run ahead of what the buy was planned against. In January, sales beat the division's budgeted cost of goods by 41%. In February, by 31%. Weight the recent month heavier, because it carries the fresher signal, and the blend lands at 34.4%. Grow February by that, and the suggested March is ₹47.13 crore.
The whole baseline in one line: the most recent completed month, grown by the efficiency signal, not the revenue slope.
Revenue fell 36% and the plan still rose, because the division kept beating its planned cost. Efficiency earns a more confident plan. Momentum alone never should.
That distinction matters more than it looks. A revenue trend rewards whatever just happened. A margin-versus-plan signal rewards a division that is outperforming its own buy, which is the thing you actually want to fund with more inventory. It is the same logic that makes sell-through a better grade than units sold: measure against the plan, not against the applause.
What one number still can't see
So far, so good, and still not a plan. ₹47.13 crore is one number for an entire division, and a division is not one thing. It is flagships and small-format stores, zones with a March festival and zones without one, a price revision landing mid-month, clearance racks doing their end-of-season work, an early summer pulling short sleeves forward, an online channel the store history never counted, and a new store opening on March 10 that today's data literally cannot see, because it doesn't exist yet.
Treat all of that as one average and the average will be wrong everywhere at once: over-bought where demand is flat, under-bought where the calendar spikes. The fix is not a smarter single number. It is taking the baseline apart, one named factor at a time, in an order that ties out.
The reconciled plan, factor by factor. Sample stand-ins for feeds not yet loaded, marked as such; the running total ties out at every line.
Nine factors, one running total
Read the stack top to bottom and notice there are only three kinds of line.
Correctors reshape the baseline. Last year's February-to-March index says the season usually lifts about 28%; blended with today's trend (one year's index is itself a small sample, so blend, never replace), the estimate settles at ₹46.08 crore.
Splitters move money without changing the total. Store grade and format divide the division number into fair slices: 45% to Grade A flagships, 35% to Grade B, 20% to small-format Grade C, with a ramped share for stores still warming up. Vendor lead times and minimum order quantities do the same at the end: same total, now dated and orderable.
Movers each carry a sign and a size. A South-zone festival adds ₹0.92 crore to that zone alone. A planned 2% price revision adds ₹0.45. Clearance takes ₹0.60 away, because markdown units sell at a lower realized value. An early summer adds ₹0.30, the online channel ₹0.50, and the Salem store opening March 10 contributes ₹0.36 at a 40% first-month ramp.
The total lands at roughly ₹48.0 crore, about two percent above the baseline. If that sounds anticlimactic, good. The point was never that the number moves dramatically. The point is that every rupee of movement now has a name, a formula and an owner. The festival line can be challenged by whoever owns the calendar. The markdown line can be switched off if the clearance plan changes. Nothing hides inside a multiplier.
Anyone can produce a number. A plan is a number with receipts.
There is also a quieter benefit. When the plan is a stack instead of a slide, the meeting changes shape. Nobody argues about whether ₹48 crore "feels right," which is a conversation with no exit. They argue about whether the festival uplift should be 8% or 6%, whether the new store really ramps at 40%, whether the price revision holds. Those are arguments the room can actually settle, and each one settled makes the plan better.
A note on the numbers. Every figure in this piece is a worked example on a representative sample dataset, not client data. The dashed lines in the stack are sample stand-ins for feeds not yet connected. The formulas are the product; your data produces your numbers.
Where the plan goes next
A reconciled plan is the middle of the story, not the end. Two things happen to it from here. First, once enough history is connected, the same factors become features, and a model layer learns the interactions the rules only approximate, festival × region × store grade, and prices the uncertainty around the number. Second, and more urgently, the sales plan has to become a buying decision: what you may actually spend once the stock you already own is counted. That number, Open-to-Buy, is the true output of merchandise financial planning, and it is almost always smaller than anyone in the room expects.
But it starts here, with a baseline you can defend and a stack you can argue with. The retailers who plan well are not the ones with the cleverest multiplier. They are the ones whose March number can survive a room full of people paid to disagree with it.
Last year × growth is a guess. A plan reconciles.
What is merchandise financial planning?
The monthly cycle that turns a sales forecast into a financial plan a retailer can act on: a target per division, reconciled against inventory and markdowns, split by store and region, and closed out as Open-to-Buy, the amount a buyer may actually spend. It is the bridge between finance's budget and the buyer's order.
How do you forecast retail sales for a coming month?
Compute a baseline from recent actuals grown by a measured signal (such as how far sales ran ahead of planned cost), then adjust one named factor at a time: seasonality, store grade splits, festivals, price moves, markdowns, weather, online demand, new stores. Keep every adjustment visible so the total reconciles line by line.
What factors should a retail forecast include?
Seasonality, store grade and format mix, regional festival and promotion calendars, price or ASP revisions, planned markdowns and EOSS, weather, omnichannel demand, vendor lead times with MOQs, and the new store pipeline. Splits and vendor terms redistribute the total; the rest move it, each on its own line.
Is this the same as demand forecasting?
No. Demand forecasting estimates what customers will buy; it is one input. Merchandise financial planning converts that estimate into a financial commitment, reconciled with inventory and markdowns and rolled up to the organization's total. A forecast can be wrong quietly; a plan gets argued with before the money moves.
About Retalp
Embedded AI agents for retail operations.
Retalp builds AI agents that run real supply-chain and retail workflows (demand forecasting, replenishment, allocation and inventory health) on top of the systems you already use. The Journal is where we write about the operational problems underneath the software. The figures in this piece are from our Merchandise Financial Planning walkthrough, the module that builds and reconciles the monthly plan.
See the plan built on your numbers.
The same walk, run on your divisions: baseline, factors, reconciliation, down to the buy. Book a walkthrough and bring your March.