The best forecasting model is the one that earns its seat.
Statistical, gradient-boosted, deep learning: a ladder, not a leap. Models compete on your own history, the winner differs by division, and the range matters more than the number.
Deep Dive9 min readAug 2026
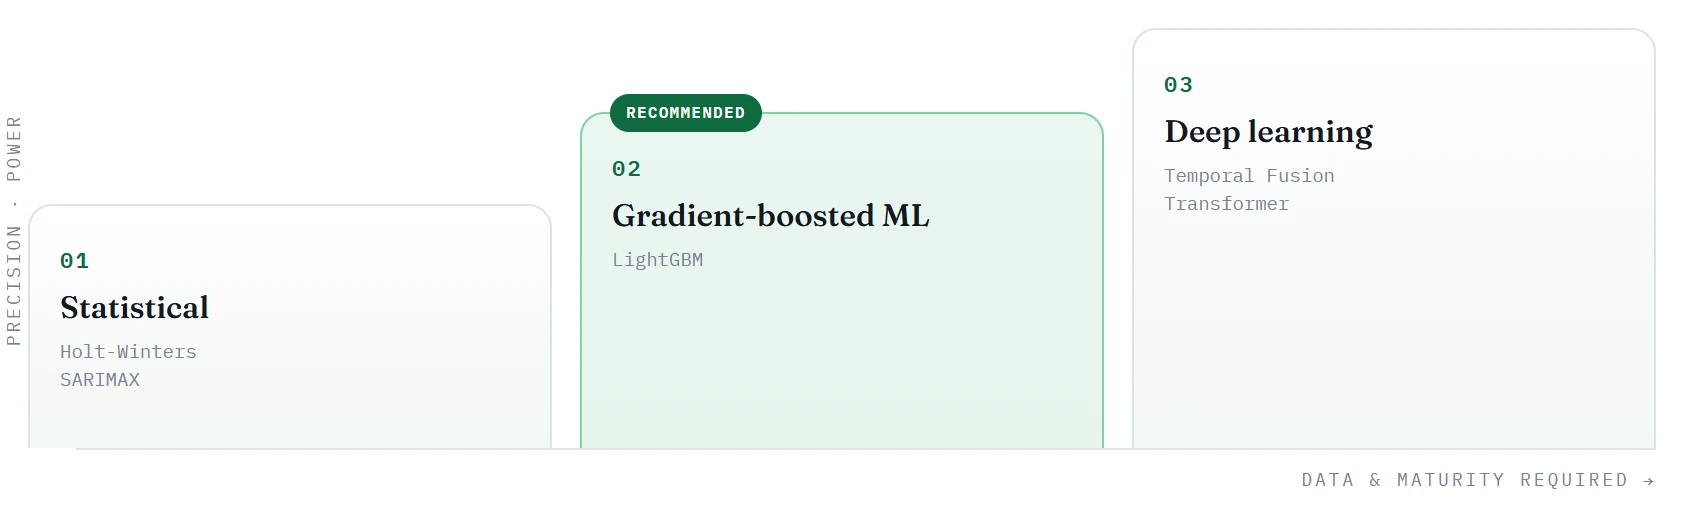
Three rungs, rising in precision and appetite for data. Divisions can run on different rungs at once; the rule-based plan stays the explainable floor.
Here is an inconvenient fact for anyone selling machine learning to retailers. On the sample division we walked in the planning piece, the hand-built, factor-by-factor rule reconciled to roughly ₹48.0 crore for March. The recommended ML model, trained on the same inputs, landed at ₹47.4 crore. A difference of about one percent. If the model's job was to produce a different number, it failed. Its job is something else, and the something else is the entire case for the model layer: not a better point estimate, but a range, a ranking of reasons, and a receipt from a competition it had to win.
A ladder, not a leap
The worst way to adopt forecasting models is the way they are usually sold: as a leap from spreadsheets to a neural network, all divisions at once, trust us. The sane path is a ladder with three rungs, where each rung demands a little more data and returns a little more precision, and where a division climbs only when its history can support the weight.
Rung one: classical time-series. Holt-Winters and SARIMAX learn level, trend and seasonality from 12-24 months of clean history, with festivals as regressors. Fully interpretable, fast to stand up, and often all a stable, seasonal division needs. On the sample data: a deseasonalized February level of ₹42.66 crore times a March index of 1.090 gives ₹46.5 crore. You can check that arithmetic on a napkin, which is precisely its charm.
Rung two: gradient-boosted trees (LightGBM). The recommended default, and the workhorse of every major public retail-forecasting benchmark of the last decade. It learns from every SKU, store and week at once, with your planning factors as features: lags, calendar, store grade, region, festival, price.
Rung three: deep learning (Temporal Fusion Transformer). A global neural model across the whole catalogue, returning probabilistic, multi-horizon forecasts. It needs scale, in SKUs, history and compute, and repays it in a currency the other rungs don't carry: a full distribution around every number.
The ladder's quiet rule is that the rule-based plan never leaves. It is the floor under everything: the explainable baseline every model must beat, and the fallback any division can stand on while its data matures.
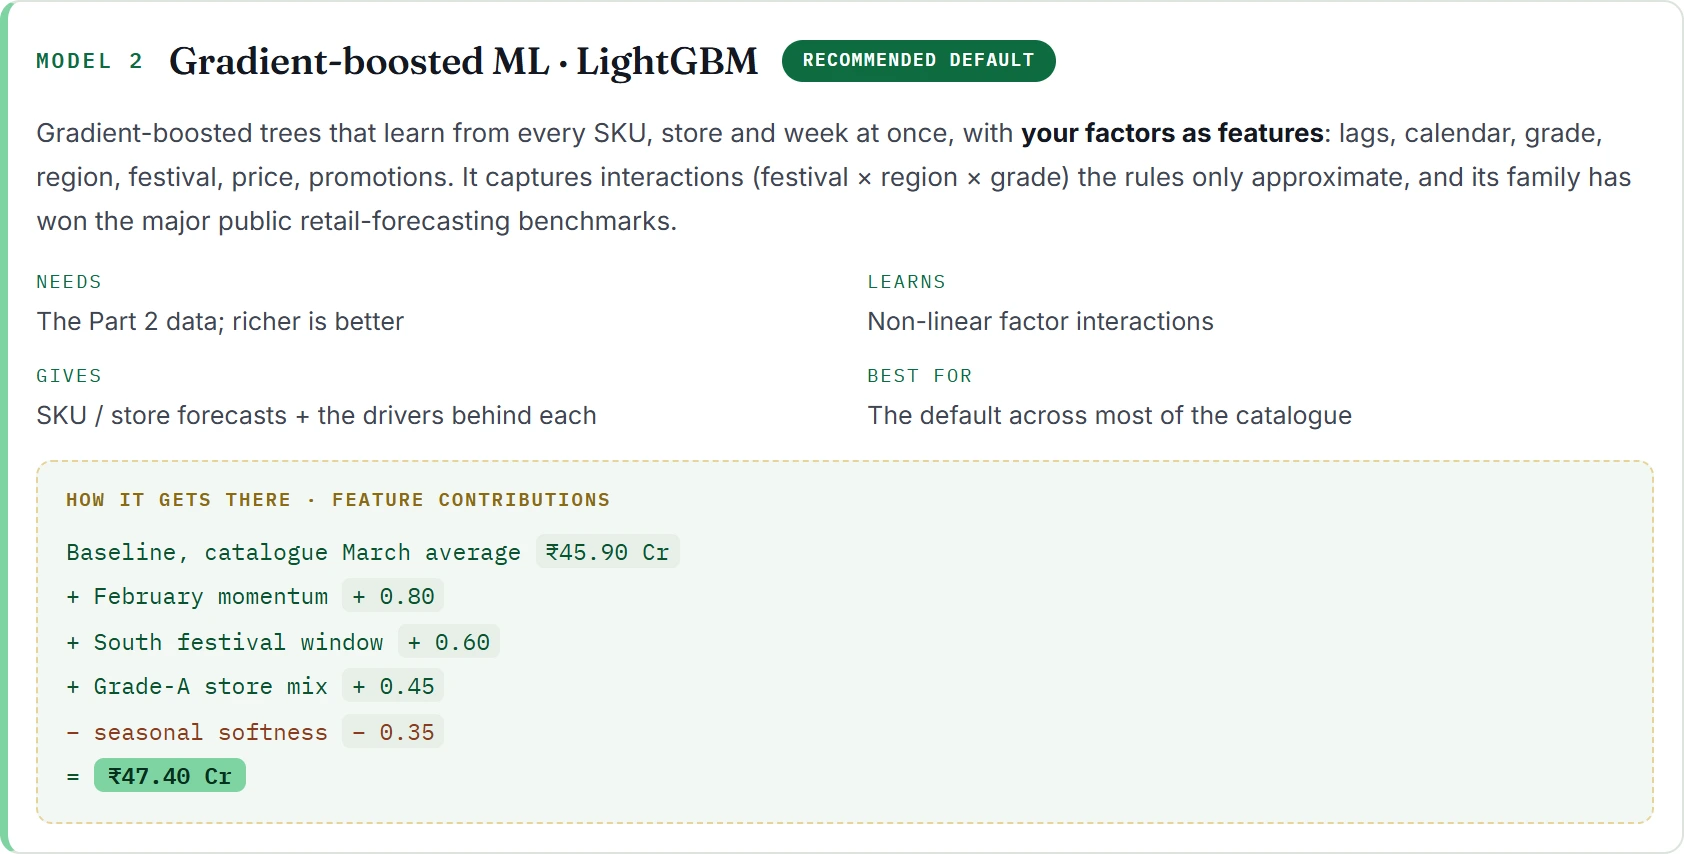
The recommended rung, showing its work: four ranked drivers on top of a catalogue baseline. Illustrative derivation on the sample dataset.
What a model sees that a rule cannot
The factor stack in the planning walk treats each signal as its own line: festival adds this, price adds that. Clean, auditable, and slightly false, because the world multiplies where the stack adds. A festival in the South doesn't lift every store equally; it lifts Grade-A stores in festival zones the most, in categories the season already favours. That three-way interaction, festival × region × grade, is exactly what gradient-boosted trees learn natively and what no hand-maintained rule can enumerate.
Look at the model card's arithmetic. It starts from a catalogue-wide March baseline (₹45.90 crore), then adds what it learned: February's momentum (+0.80), the South festival window (+0.60), the Grade-A store mix (+0.45), and a seasonal softness pulling the other way (−0.35). The result, ₹47.40 crore, arrives with its reasons ranked. A planner reading it knows not just the number but which levers made it, and by how much.
A forecast a planner can't interrogate is not a forecast. It's a superstition with a decimal point.
That is why explainability is not a compliance checkbox here. Feature importance and attention weights are the difference between a planning meeting that debates the drivers and one that debates whether to trust the machine. The first meeting gets somewhere.
Champion and challenger: no model is believed, every model is tested
The second discipline is harsher, and it is the one most rollouts skip. No model is picked on reputation. Each division's candidates are backtested on that division's own history: hold out the recent months, forecast them blind, measure the error. The lowest error takes the seat, and keeps being re-examined as new months arrive.
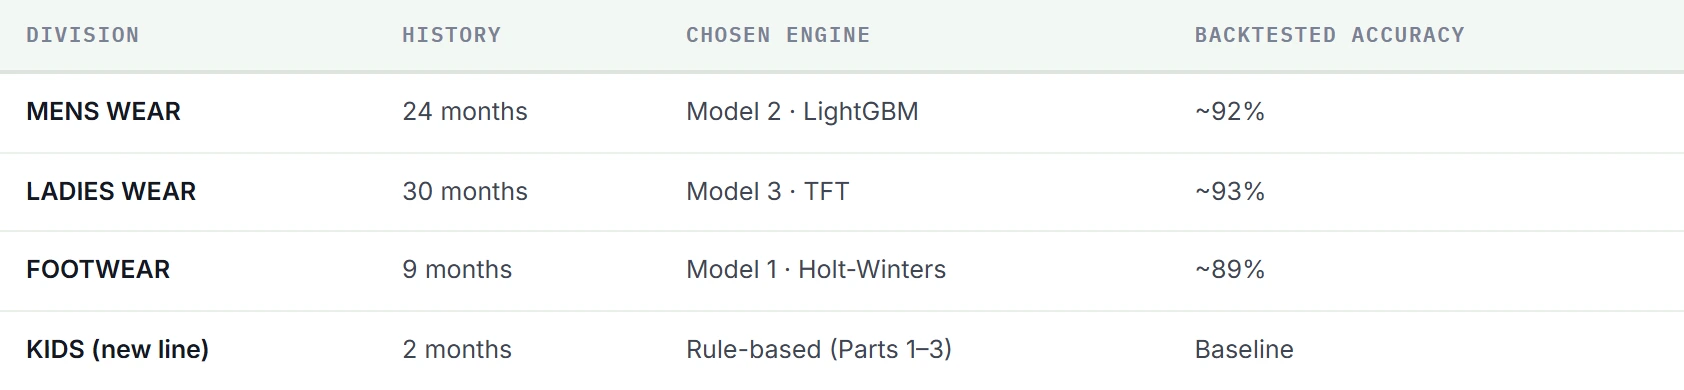
One organization, four engines, each earned on its own division's backtests. The new line runs on the rule until any model beats it.
Read that table as a policy, not a leaderboard. The menswear division, with 24 months of history, earned LightGBM. Ladieswear, with 30 months and a deeper catalogue, earned the transformer. Footwear, nine months old in the data, runs Holt-Winters because that is what nine months can honestly support. And the kids line, two months old, runs on the rule, because a model that hasn't beaten the baseline on your numbers has no business producing them. Different rungs, simultaneously, per division: that is what "the right model" actually looks like in production.
The range is the point
Back to the inconvenient fact: rule ₹48.0, model ₹47.4. Within one percent. What did the model add? Two things the rule structurally cannot.
First, a priced band instead of a point. The model's 80% confidence range runs ₹44.9 to ₹49.8 crore. That band is not decoration; it is the sizing instruction for risk. Safety stock gets set to the upper percentile (the P90), not the median, because the cost of missing a sale on your proven sellers is not symmetric with the cost of holding a little extra. Anyone who has watched their fast movers go out of stock in week two of a festival knows which side of that trade hurts more.
Second, a monthly re-examination built in. The champion re-earns its seat as data grows; a challenger that starts winning takes over. The system's accuracy is not an installation-day claim, it is a running score.
And two things stay yours, permanently: the objective (tune the same forecast toward service level, margin or working capital, depending on what the season needs) and the constraints. Vendor MOQs, lead times and the Open-to-Buy budget are hard walls the model optimizes inside, never around.
A note on the numbers. Every figure in this piece is an illustrative derivation on a representative sample dataset, the shape of the reasoning rather than a full training run. The backtest, not this page, is what earns a model its seat on your data.
The rule orients the room. The model prices the risk.
So the answer to "which forecasting model should we use?" is a process, not a product name. Stand up the transparent rule first, because a plan the room can argue with beats a black box the room must trust. Connect the history and the factor feeds. Then let the models fight for each division on its own numbers, and give the seat to whatever wins, for as long as it keeps winning. The retailers who get value from ML forecasting are not the ones who bought the fanciest model. They are the ones who made every model, fancy or not, show its work and earn its keep.
Which forecasting model is best for retail?
The best model per division, proven by backtesting, not one best model overall. Classical time-series suits stable, seasonal divisions with thin history; gradient-boosted trees (LightGBM) are the strongest default across most catalogues; deep learning (TFT) pays off on large assortments where probabilistic forecasts drive safety stock and service levels.
Do you need machine learning to forecast demand?
Not to start. A transparent, factor-based rule produces a defensible plan and is always the right baseline. ML earns its place when it beats that rule on your own history in backtests, typically once 12-24 months of clean data and the store, calendar and price feeds are connected.
What is champion-challenger?
Hold out recent months, let every candidate model forecast them blind, and measure the error. The lowest-error model becomes the champion and produces the plan; challengers keep running and take the seat when they win consistently. New divisions stay on the rule-based baseline until a model earns it.
What data does ML forecasting need?
The same feeds a good manual plan needs: 12-24 months of sales and inventory, store grades and formats, festival and promotion calendars, price and markdown plans, vendor lead times, and the new store pipeline. Models consume these as features and learn the interactions between them.
About Retalp
Embedded AI agents for retail operations.
Retalp builds AI agents that run real supply-chain and retail workflows (demand forecasting, replenishment, allocation and inventory health) on top of the systems you already use. The Journal is where we write about the operational problems underneath the software. The figures in this piece are from our Merchandise Financial Planning walkthrough, the module where the model ladder runs.
Make the models compete on your history.
Backtests on your divisions, champions earned on your numbers, and a plan that shows its work. Book a walkthrough.